Mermaid https://mermaid.live/ offers a powerful, yet simple way to create and maintain business process diagrams which unlock valuable insights, streamline operations and identify areas for improvement.
On this pageJump to a section
Mermaid’s versatility allows you to create simple and complex diagrams.
Why Mermaid for Business Process Mapping?
Mermaid offers a simple, text-based syntax to create a wide variety of diagrams, making it the perfect tool for mapping out complex business processes.
With Mermaid, you can easily create flowcharts, sequence diagrams, class diagrams, and entity relationship diagrams.
These visuals empower you to identify bottlenecks, streamline workflows, and improve overall efficiency.
Key Benefits of Mermaid in Business Process Analysis
- Efficiency: Quickly create and update diagrams using Mermaid’s simple text-based syntax.
- Version Control: Integrate Mermaid diagrams with version control systems to track changes over time.
- Collaboration: Share and collaborate on diagrams with team members easily, fostering a culture of continuous improvement.
- Flexibility: Customize diagrams with different styles and themes to suit your organization’s branding.
- Integration: Embed Mermaid diagrams in various documentation tools for seamless communication.
Getting Started with Mermaid
Mermaid is free and open-source – meaning you can install and run it on your own network, or use the free cloud hosted version.
Free cloud hosted version
I prefer to use the free cloud hosted version at https://mermaid.live/
Installation and Setup
To install Mermaid, follow these steps:
- Install Node.js and npm (Node Package Manager).
- Run
npm install -g mermaidto install Mermaid globally. - Start using Mermaid by creating a
.mmdfile and adding your diagram code.
Understanding text syntax
Mermaid is a text-based tool – where you use text to design the diagrams.
Detailed documentation on the markup syntax is found at Flowcharts Syntax | Mermaid
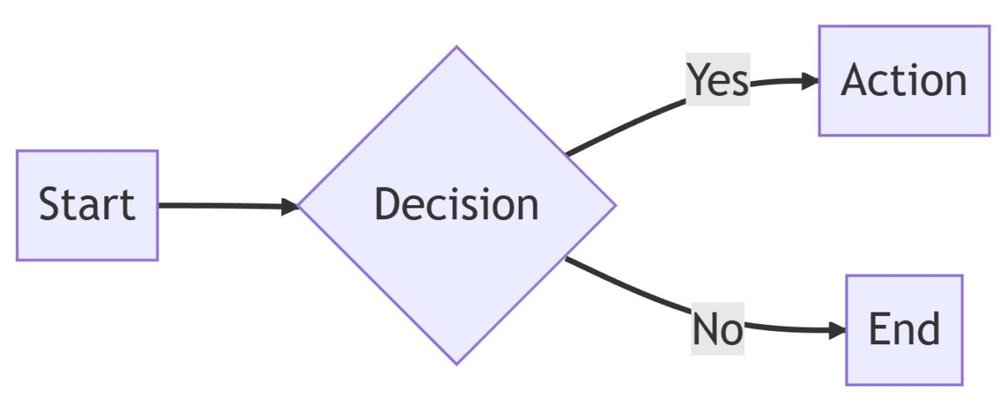
Creating Flowcharts
Flowcharts are an excellent way to visualize your business processes.
Simply use the graph keyword, followed by the direction (TB, BT, LR, or RL) to define the layout.
Then, use arrows (-->) to connect nodes.
For example:
graph LR
A[Start] --> B{Decision}
B -->|Yes| C[Action]
B -->|No| D[End]

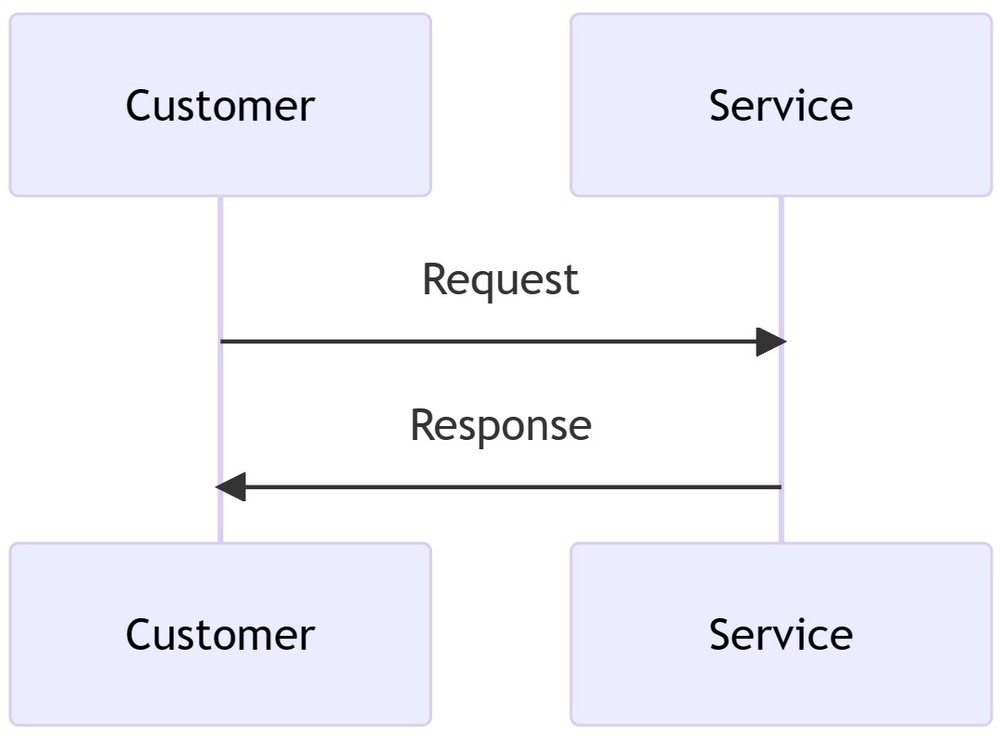
Sequence Diagrams
Sequence diagrams show interactions between entities over time.
To create a sequence diagram, use the sequenceDiagram keyword and define your participants.
Then, use arrows (-->) to indicate communication between them.
Example:
sequenceDiagram
participant A as Customer
participant B as Service
A->>B: Request
B->>A: Response
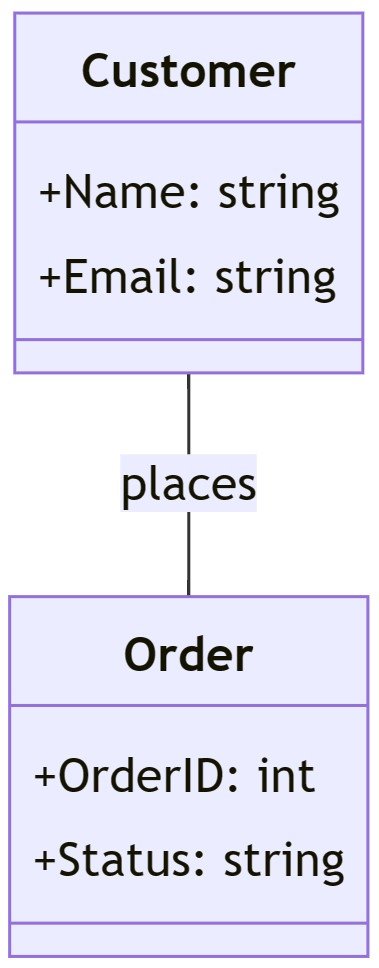
Class Diagrams
Class diagrams help you visualize relationships between different entities in your business process.
Use the classDiagram keyword to create a class diagram, and define classes, properties, and relationships using Mermaid’s simple syntax.
Example:
classDiagram
class Customer {
+Name: string
+Email: string
}
class Order {
+OrderID: int
+Status: string
}
Customer -- Order: places
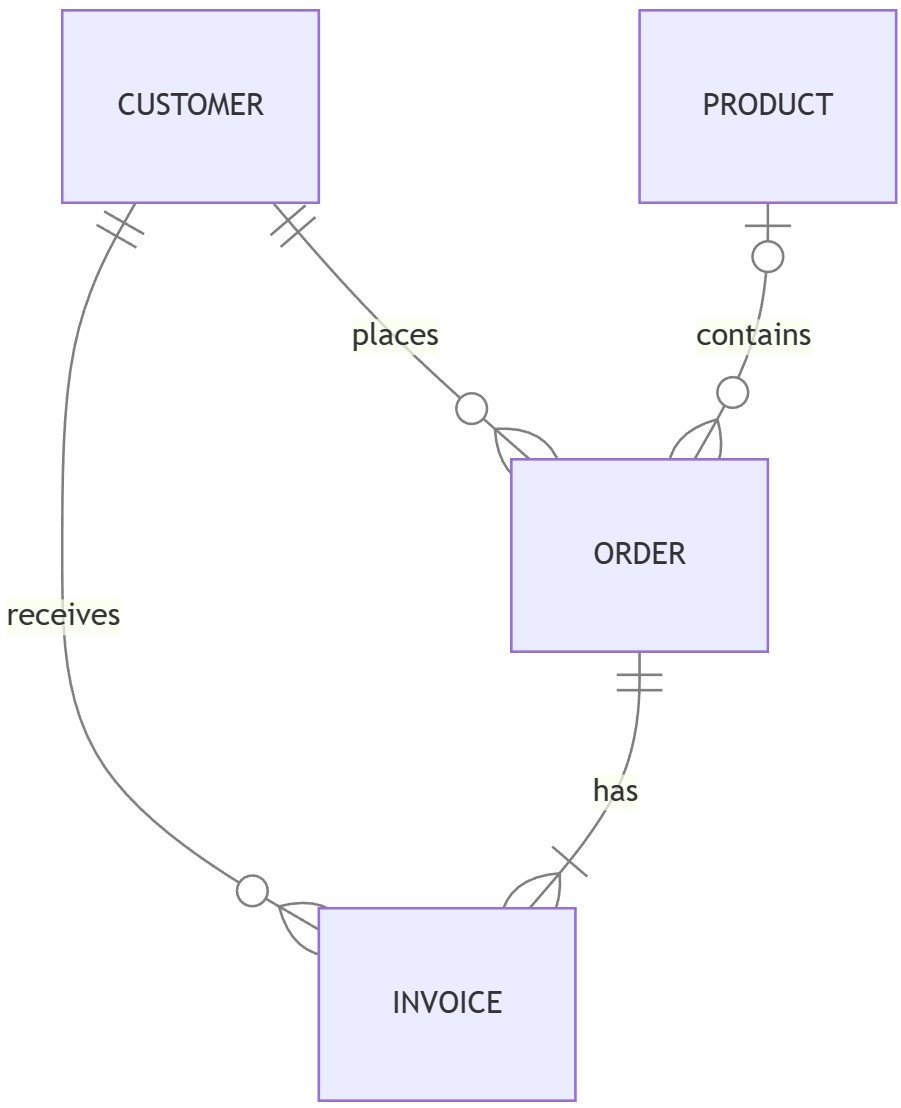
Entity Relationship Diagrams
Entity Relationship Diagrams (ERDs) are used to visualize the relationships between different entities within a system.
They can be particularly helpful when designing databases or analyzing data models. Mermaid allows you to create ERDs using a straightforward syntax.
In this example, we have four entities: CUSTOMER, ORDER, INVOICE, and PRODUCT. The relationships between these entities are defined using different cardinality notations.
Example:
erDiagram
CUSTOMER ||--o{ ORDER : places
CUSTOMER ||--o{ INVOICE : receives
ORDER ||--|{ INVOICE : has
PRODUCT |o--o{ ORDER : contains
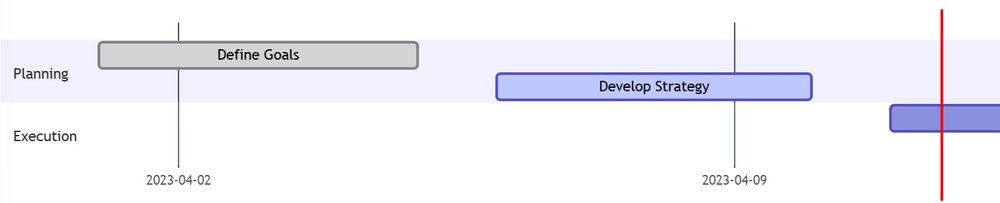
Gantt Charts
Mermaid also supports the creation of Gantt charts, which are useful for visualizing project timelines and dependencies.
Use the gantt keyword to create a Gantt chart and define tasks, sections, and milestones.
This example Gantt chart has two sections, Planning and Execution, with tasks and their respective start and end dates.
Example:
gantt
dateFormat YYYY-MM-DD
title Project Timeline

section Planning
Define Goals :done, 2023-04-01, 2023-04-05
Develop Strategy :active, 2023-04-06, 2023-04-10

section Execution
Implement Plan :2023-04-11, 2023-04-30
Evaluate Results:2023-05-01, 2023-05-10
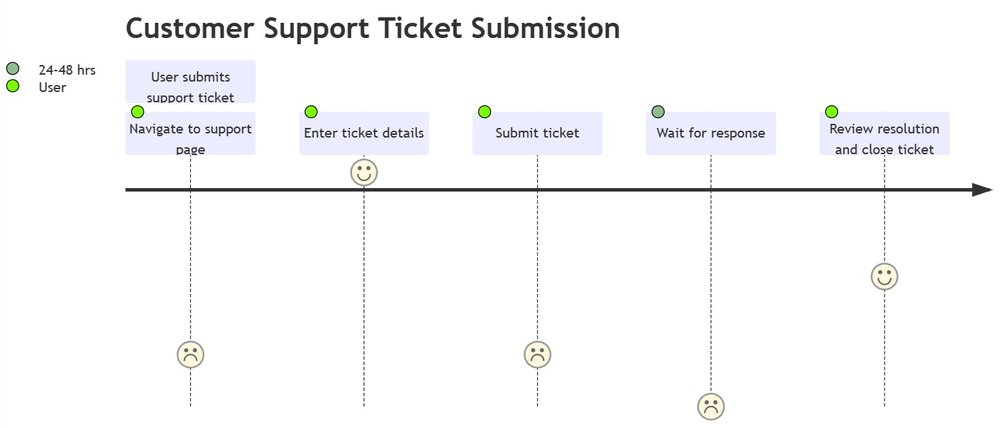
User Journey Diagrams
User journeys detail the exact steps users take to complete a task within a system, allowing businesses to understand the current workflow and identify areas for improvement.
By analysing user journeys, businesses can make data-driven decisions that optimise the user experience and streamline business processes.
For example:
journey
    title Customer Support Ticket Submission
    section User submits support ticket
      Navigate to support page: 2: User
      Enter ticket details: 9: User
      Submit ticket: 2: User
      Wait for response: 0 : 24-48 hrs: User, Support Team
      Review resolution and close ticket: 5: User
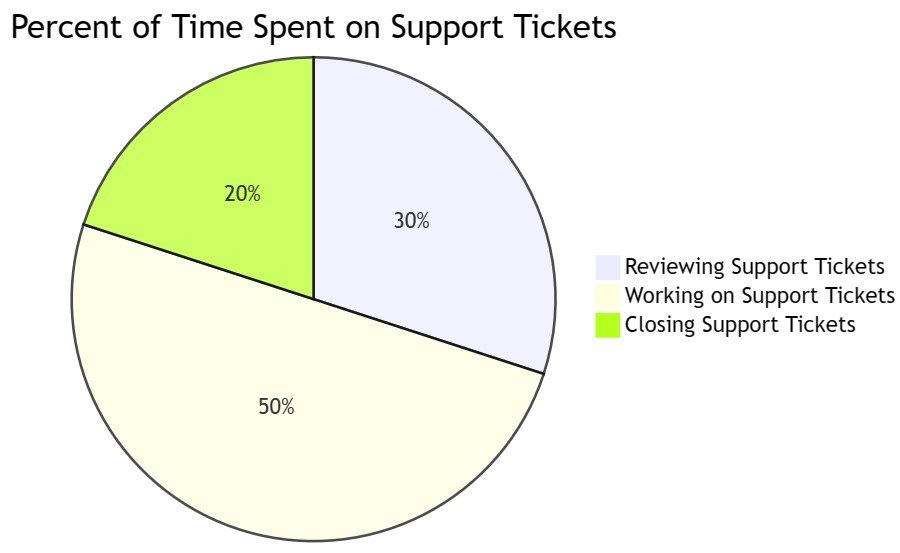
Pie Charts
A pie chart is a circular statistical graphic that can be used to represent values relative to other values – for example time spent on to support tickets, with each slice representing the proportion of time spent on reviewing, working on, and closing support tickets.
For example:
pie title Percent of Time Spent on Support Tickets
    "Reviewing Support Tickets" : 30
    "Working on Support Tickets" : 50
    "Closing Support Tickets" : 20
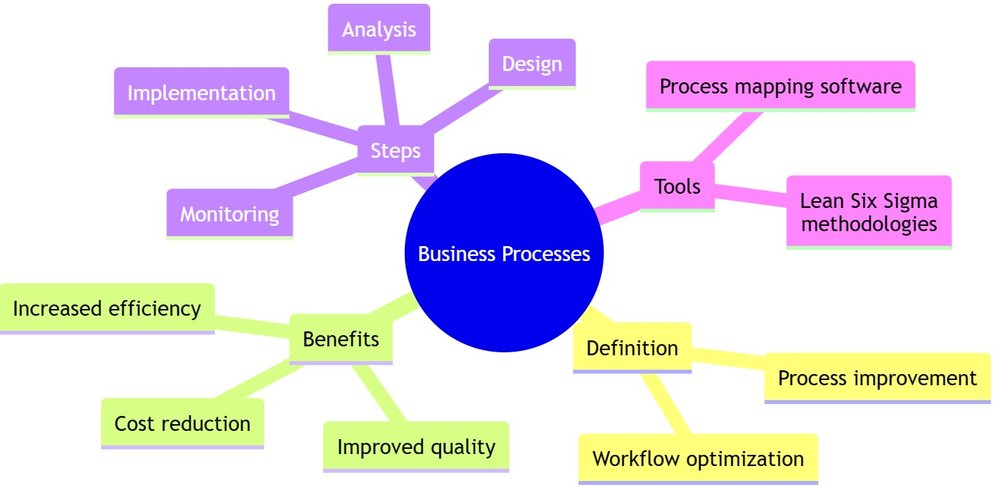
Mind Maps
Mind maps are hierarchical diagrams used in business processes to visually organize and show relationships among ideas and concepts, starting from a central idea with major and minor branches.
They are usually created around a single concept, drawn as an image in the center of a blank page and used as a group thinking tool.